


Rules for Electron Configurations
 I wish you'd stop being so mysterious and explain these "rules" you keep
referring to.
I wish you'd stop being so mysterious and explain these "rules" you keep
referring to.
 I was just about to do that. I have to warn you, though, that the rules may
seem arbitrary to you, and I won't be giving any satisfactory explanation of
the reasons for them. Partly that's because I want to spare you a lot of
complicated math, and partly it's because this is just the way nature is.
I'll just ask you to have faith that all this numerology comes out of a
sophisticated mathematical theory, and has been upheld time after time by
experiment.
I was just about to do that. I have to warn you, though, that the rules may
seem arbitrary to you, and I won't be giving any satisfactory explanation of
the reasons for them. Partly that's because I want to spare you a lot of
complicated math, and partly it's because this is just the way nature is.
I'll just ask you to have faith that all this numerology comes out of a
sophisticated mathematical theory, and has been upheld time after time by
experiment.
 I can, if you like, tell you about quantum numbers; they provide a more
quantitative way of understanding these rules.
I can, if you like, tell you about quantum numbers; they provide a more
quantitative way of understanding these rules.
|

|
 For now I think I'll be satisfied if you can tell me how to predict those
electron arrangements you've been showing me.
For now I think I'll be satisfied if you can tell me how to predict those
electron arrangements you've been showing me.

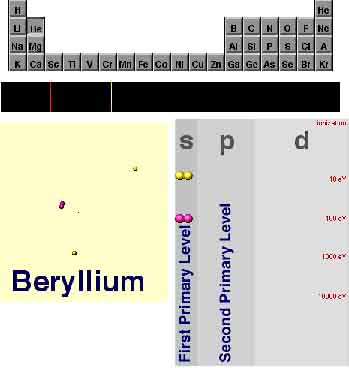 I can do that. First of all, you were correct when
you guessed that those colored rows in the chart correspond to the "main
energy levels"; they're often called primary energy levels,
incidentally. Usually, a higher row means a higher energy, and energy gaps
between rows tend to be quite large, in comparison with the gap between,
say, s and p.
I can do that. First of all, you were correct when
you guessed that those colored rows in the chart correspond to the "main
energy levels"; they're often called primary energy levels,
incidentally. Usually, a higher row means a higher energy, and energy gaps
between rows tend to be quite large, in comparison with the gap between,
say, s and p.
 Are you ever going to explain what s and p mean?
 I'll do that right now. As you surmised, the s, p, and d
columns represent smaller "sublevels" of the primary rows...
I'll do that right now. As you surmised, the s, p, and d
columns represent smaller "sublevels" of the primary rows...
 Then why not just call them A, B, and C, or something else at least vaguely
logical?
Then why not just call them A, B, and C, or something else at least vaguely
logical?
 This is a bit of archaic notation left over from nineteenth century
spectroscopy--rather silly, but everyone uses it, so we're stuck with it. If
you must know, s stands for "sharp," p is for "principal," and d is for
"diffuse"--supposedly they refer to the appearance of various spectral lines.
The next one is called f, for "fundamental"; mercifully, the subsequent ones
just go alphabetically: g, h, etc.
This is a bit of archaic notation left over from nineteenth century
spectroscopy--rather silly, but everyone uses it, so we're stuck with it. If
you must know, s stands for "sharp," p is for "principal," and d is for
"diffuse"--supposedly they refer to the appearance of various spectral lines.
The next one is called f, for "fundamental"; mercifully, the subsequent ones
just go alphabetically: g, h, etc.
|

|


